Welcome to the population pyramids simulator
From this page you can investigate the population pyramids of over 90 countries between the years 1780 to 2011.
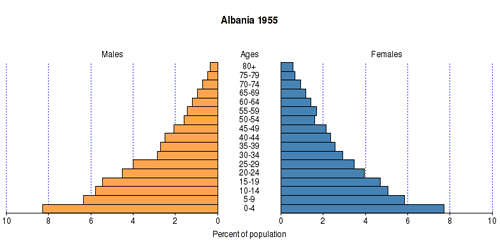
Population pyramids show the age and sex structure of the population at any given point in time, giving us information about the numbers and proportions of people alive at each age and sex as well as giving us an indication of the 'dependant' population (those under 15 and over 65). Pyramids express a populations life expectancy, birth and death rates.
Earth is not a place of equilibrium. Disturbances to the peace could be abrupt jolts (e.g., wars, global pandemics) or ongoing changes (e.g., agricultural intensification) that persistent signatures far into the future. In Europe, and beyond, the second world war left millions dead but those that survived produced a baby-booming generation that are now reaching an age where their increased relative abundance poses financial, social and moral questions for population health. These questions do not arise from an equilibrial view of the world, but rather one in which transient events leave a quantifiable imprint in the age-structure of populations.
Click the image to launch the app and explore transient dynamics in human populations from 1780 to 2011. The first page is Australia with the default "Percent" view showing the classical filling up of the age-structure despite declining fertility rates. The country with most years of data is Sweden (1780-2011). Hans Rosling gave a four minute introduction into this phenomenon on Newsnight (link), merging database driven science with practical demonstrations using everyday household items.
This filling up phenomenon is often termed momentum. Consider a large ship attempting to turn east at a fixed point from a northerly course. By the time the ship achieves a perfect easterly bearing, it will have drifted north of its intended turning point as a result of the ship's physical momentum. In a demographic context, this momentum is what Rosling calls the breaking distance in the linked video clip. Our Wellcome Trust funded project seek to build mathematical and statistical models to assess what drives these transients, their demographic impacts and their consequences for population health.


